Viral coefficient: how many new people each person brings, and why 1 is the frontier

By Tiago Costa·Updated on August 5, 2026

Definition
The viral coefficient is how many new people each person reached brings in.
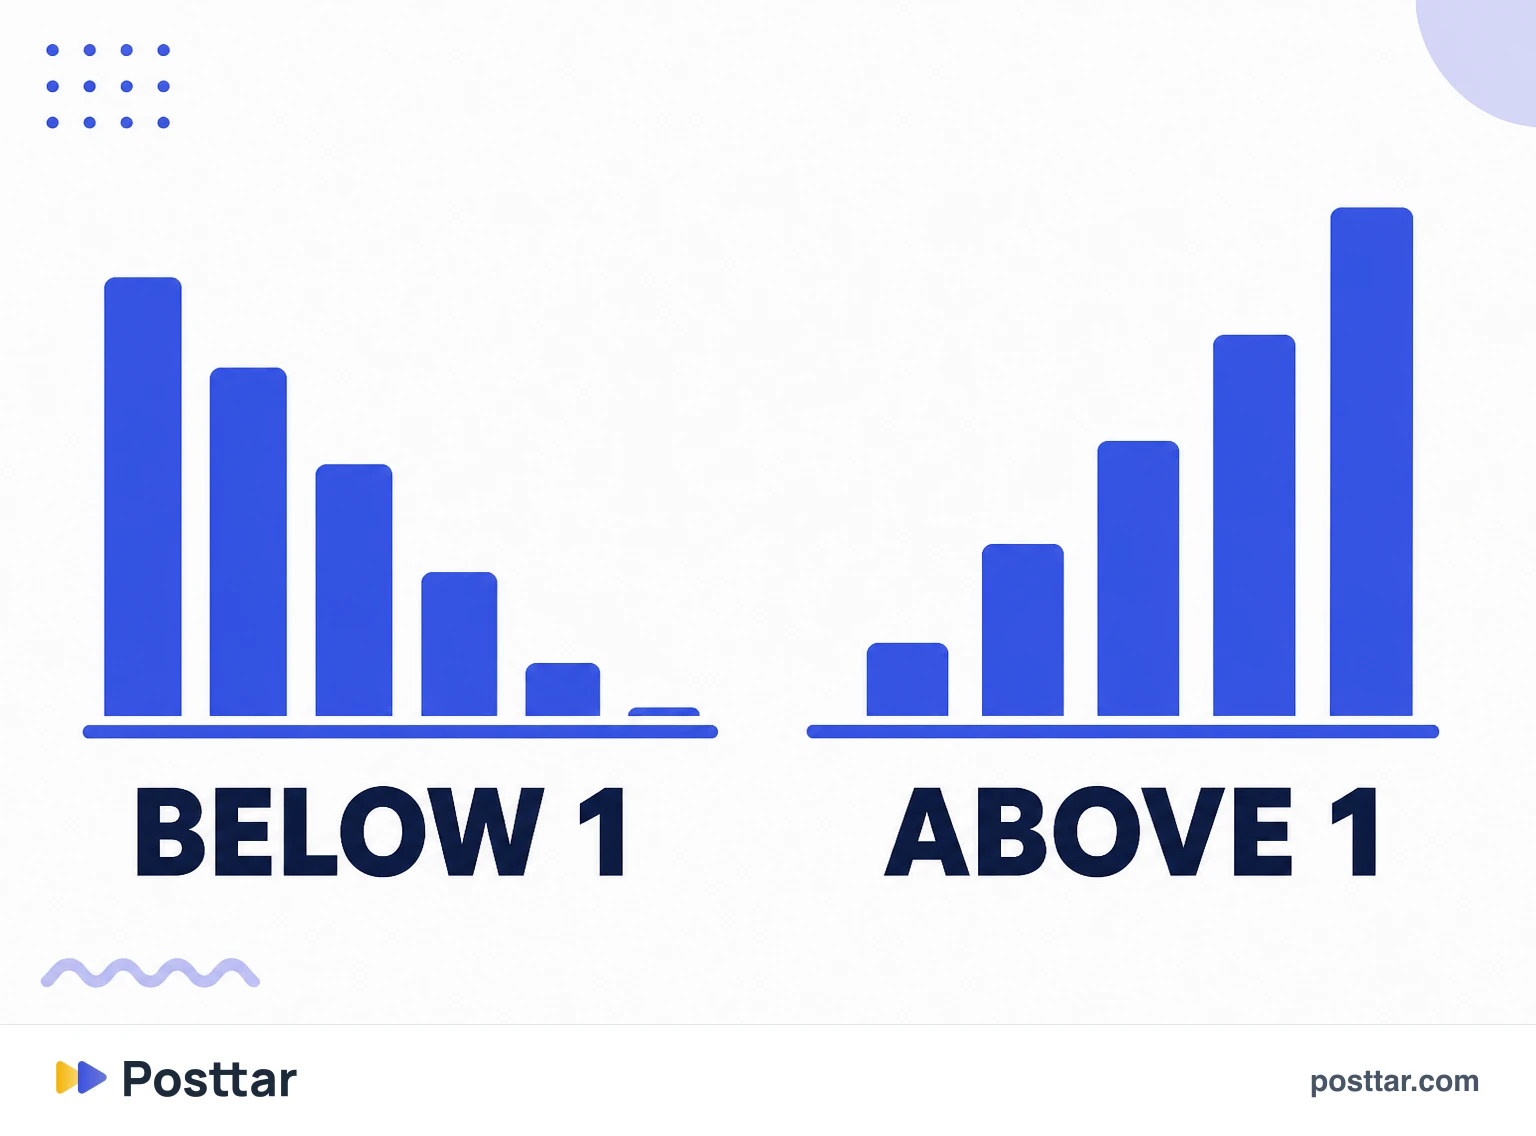
- Above 1, reach multiplies on its own.
- Below 1, the curve fades even after a strong start.
- It comes from product, and in content becomes shares over reach.
- A viral is that repeated over several consecutive rounds.
What it is and where it comes from
The viral coefficient, often called the k factor, was born in product and in epidemiology. The original question is the same in both: how many new cases does each case generate?
In product, the classic calculation multiplies how many invitations each user sends by the conversion rate of those invitations. If each user invites 10 people and 15 per cent accept, the coefficient is 1.5, and the base grows on its own.
In content the logic is identical, changing what counts as an invitation: the invitation is the share, and conversion is how many of those people actually watch.
Why 1 is the frontier
This is the point that makes the metric worth knowing, and it is mathematical rather than a matter of opinion.
- Coefficient 0.5. A thousand people bring 500, who bring 250, then 125. The sum converges and stops.
- Coefficient 1. A thousand bring a thousand, who bring a thousand. Stable, no growth.
- Coefficient 1.5. A thousand bring 1,500, who bring 2,250, who bring 3,375. It explodes.
The difference between 0.9 and 1.1 looks small and is the difference between content that dies in two days and content that runs for weeks. Which is why going viral feels like an all or nothing phenomenon: near the frontier, a minimal variation changes the outcome entirely.
How to look at this in content
On Instagram you do not get the coefficient handed to you, but you can approximate it with what insights show.
The most direct reading is the ratio between shares and reach. It is not the literal coefficient, because not every share becomes a new view, but it moves alongside it and works for comparing pieces against each other.
Another useful approximation is the share of reach coming from non followers. The higher it is, the more the content is travelling outside your base, which is exactly what a high coefficient produces.
The practical use is not nailing a number, it is ranking: which of your pieces have the highest share ratio, and what they have in common.
How to raise it
There are only two levers, and they come straight from the formula.
Raise the number of invitations, meaning how many people share:
- Give a clear social reason. Whoever shares is saying something about themselves.
- Make content that serves a specific person, the kind you send to one individual.
- Make passing it on easy: short, understandable without context, with the whole idea inside it.
Raise invitation conversion, meaning how many actually watch what was shared:
- A first image and first seconds that work for someone arriving with no context.
- No dependence on an inside joke or on knowing the account.

Checklist
- I compare my pieces by the ratio between shares and reach.
- I know that below 1 the curve fades on its own.
- My content works for someone arriving with no context at all.
- There is a social reason for someone to pass it on.
- I track the share of reach coming from non followers.
Frequently asked questions
What is a viral coefficient?
It is the number of new people each person reached brings to the content or product. Above 1, reach multiplies on its own each round; below 1, it shrinks until it stops, even after a strong start.
How to measure viral coefficient?
The classic formula multiplies the number of invitations each person sends by the conversion rate of those invitations. In content, the invitation is the share and conversion is how many of those people actually watch.
What is the k factor?
It is another name for the viral coefficient, borrowed from epidemiology, where it measures how many new cases each case generates. The question is identical in product and in content: how many new units does each unit reached produce.
Can you measure the viral coefficient on Instagram?
Not directly, because insights do not expose that number. The practical approximation is the ratio of shares to reach, plus the share of reach coming from non followers. It works for comparing pieces against each other, not as an absolute value.
At what point is content considered viral?
There is no universal view count, because it depends on account size. The structural criterion is the coefficient: when each person reached brings in more than one new person, the content distributes itself, and that is what characterises a viral.
Related concepts

Going viral
Going viral is when a piece of content starts being distributed mainly by the people consuming it rather than by the platform's initial delivery. The mechanism is multiplication: each person reached brings in more than one new person. It is not luck or an algorithm trick, it is the result of a piece that gives viewers a strong reason to show it to someone else.
Read the entry
Shares
A share is when someone sends your post to another person in Direct or reposts it to their own Stories. It is the most expensive interaction for the person acting, because it requires choosing a recipient and owning the recommendation, and that is why it pushes distribution outside your audience harder than anything else. No other interaction delivers content to a non follower through a human recommendation.
Read the entry
Reach
Reach is the number of unique accounts that saw a piece of content at least once. Unlike impressions, it does not count the same person twice, so it measures the size of the audience touched rather than the volume of exposure. On Instagram, reach is reported per post and per period, and it can be split between followers and non followers, which is the reading that shows whether a profile is discovering new people or simply circulating among those who already follow it.
Read the entry
Share rate
Share rate is the percentage of people who saw a piece of content and sent it to someone else, calculated by dividing shares by reach. Among all engagement metrics, it is the one that best anticipates growth, because every share carries the piece to an audience that is not yours, with a layer of human recommendation that no automatic delivery has.
Read the entry