Watch time: the video metric the algorithm actually observes

By Tiago Costa·Updated on August 5, 2026
Definition
Watch time is the total time people spent watching, summing every play.
- It is volume, not percentage. Retention is the percentage version.
- It includes replays. Watching twice adds twice.
- It grows with video length, so do not compare different durations.
- It is one of the strongest quality signals for distribution.
What the metric measures
Watch time sums seconds. If a hundred people watched ten seconds each, the total is a thousand seconds, regardless of whether the video runs fifteen seconds or two minutes.
It is a volume metric, so it grows with three things at once: how many people watched, how much each one watched and how many times they rewatched. Separating those three contributions is exactly what average retention and the retention curve do.
From a distribution standpoint, watch time is one of the most reliable signals there is, because it does not depend on someone deciding to act. Liking is a choice; staying to watch is behaviour.
Total time versus retention
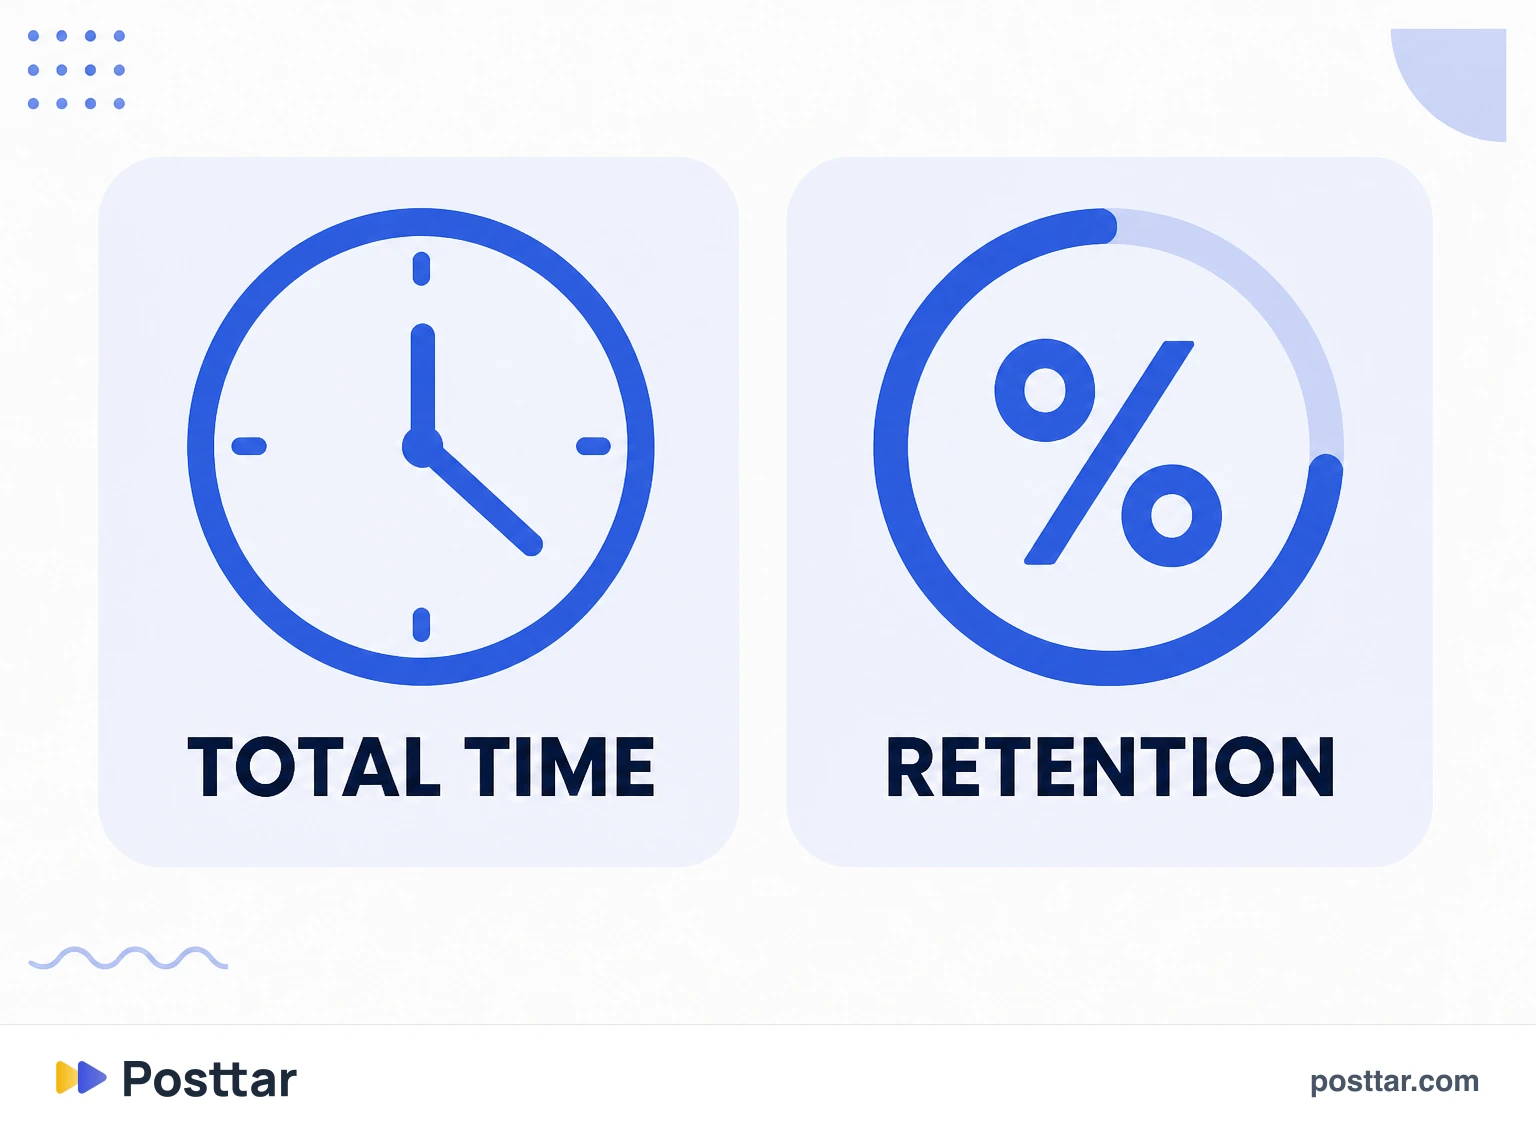
Both measure the same phenomenon in different units, and confusing one for the other leads to opposite decisions.
| Metric | Unit | Grows with |
|---|---|---|
| Watch time | seconds, minutes | audience, duration and replays |
| Average retention | percentage | only how much of the video is watched |
A two-minute video with 20% retention delivers 24 seconds per person. A fifteen-second one at 90% delivers 13.5. The first accumulates more total time and the second holds attention better. Neither is obviously superior, which is why both numbers have to be read together.
Why short video seems to win
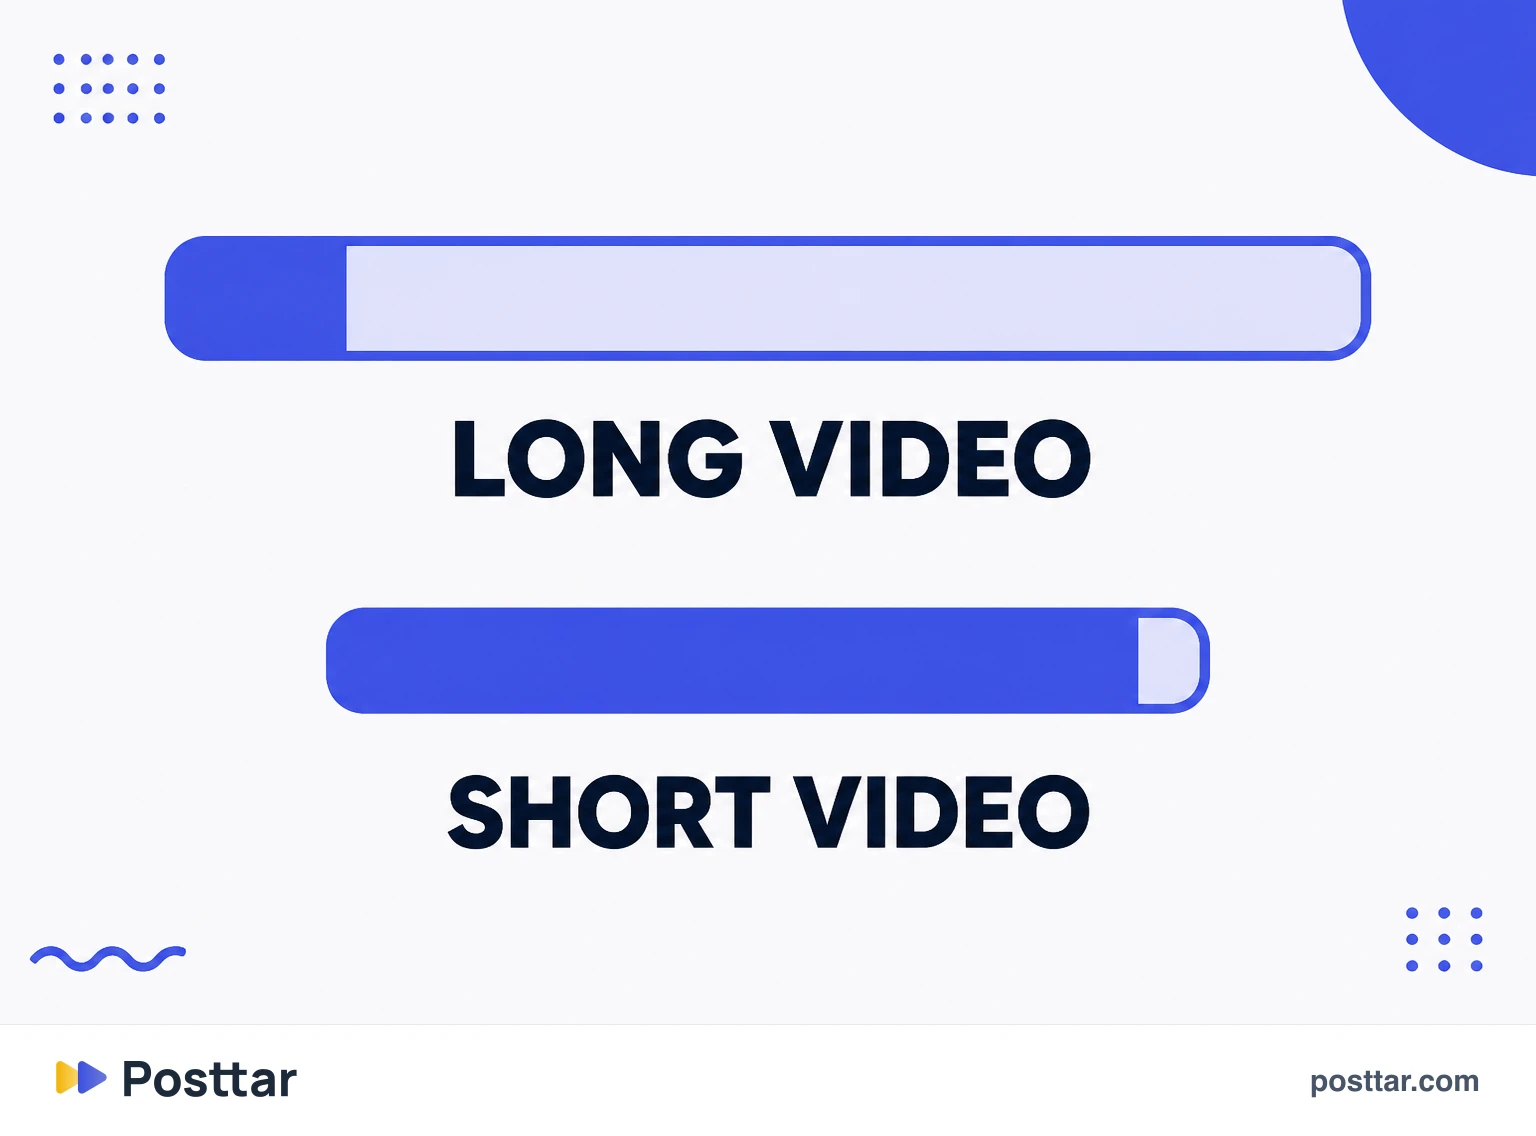
Short formats have a structural advantage in retention and in replays: it is easy to watch 100% of a ten-second video, and it commonly loops on its own, adding time.
That creates a reading trap. Comparing a 12-second Reel with a 60-second one, the percentages favour the short and the total time favours the long, almost always. Comparing without splitting by duration band produces wrong conclusions in both directions.
The practical fix is grouping. Compare videos of similar length with each other, and treat different bands as different formats, the same way you would not compare a carousel with a single photo.
What to do with the number
- Use it as an aggregate quality signal. Total time rising month over month, at the same posting cadence, indicates improving content.
- Cross-check with reach. High time with low reach is good content that was not distributed: worth rewriting the hook and republishing.
- Do not chase it by lengthening the video. Stretching to add seconds lowers retention and, with it, delivery.
- Wait. Reels accumulate time for weeks, so a 24-hour reading understates.
Checklist
- I do not confuse total time with percentage retention.
- I compare videos of similar length.
- I read it alongside the retention curve, to know where the time was lost.
- I do not lengthen video just to inflate the number.
- I give it at least a few days before judging.
Frequently asked questions
What is watch time on Instagram?
It is the total amount of time people spent watching your video, summing every play including repeats. It is measured in minutes or hours and appears in the insights of a professional account.
What is the difference between watch time and retention?
Watch time is volume, measured in seconds or minutes. Retention is a percentage: what share of the video was watched, on average. A long video can have higher total time and worse retention than a short one.
Does watch time affect reach?
Yes, considerably. It is one of the most reliable quality signals for the ranking system, because it measures behaviour instead of depending on someone deciding to like or comment.
Should I make longer videos to increase watch time?
Not as a standalone strategy. Stretching a video raises the possible total time and usually lowers percentage retention, which is also observed. What works is keeping the length the idea needs and improving the hook and the pacing.
Do replays count towards watch time?
They do. If the same person watches twice, both periods add up. It is one reason short videos, which loop on their own, accumulate time easily.
Related concepts
Average retention
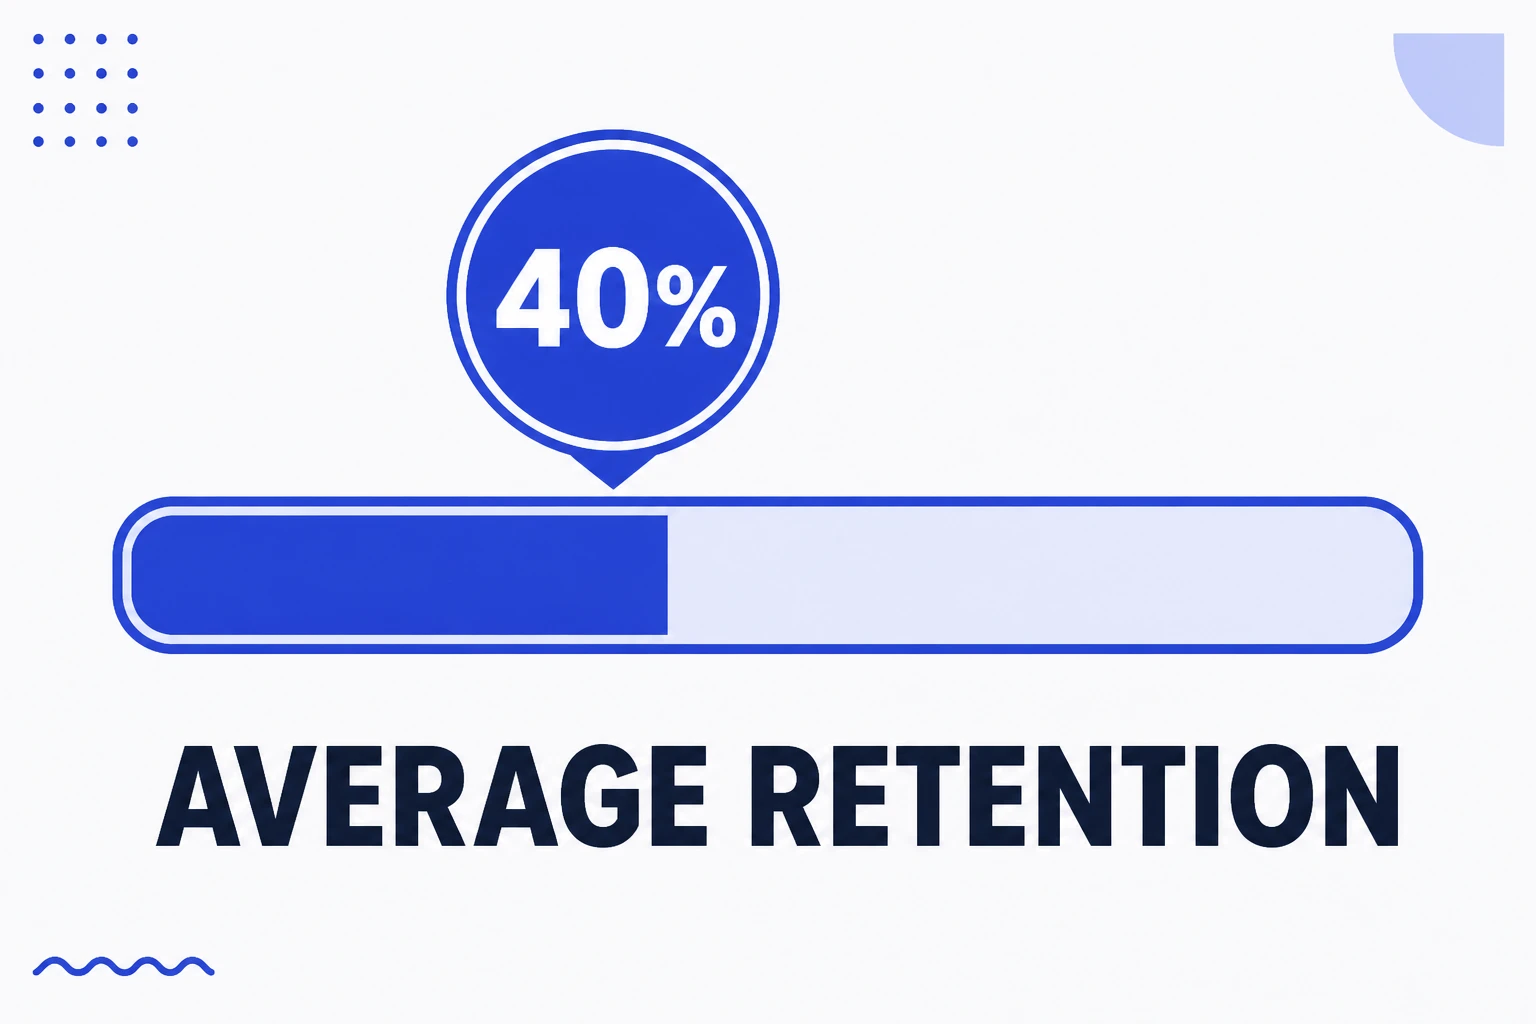
Average retention is the percentage of a video people watched, on average, before leaving. It is the percentage version of watch time, and it exists to make videos of different lengths comparable. It falls naturally as a video gets longer, which means comparing a ten-second Reel with a one-minute one using the same number is a misreading.
Read the entry
Retention curve
The retention curve is the chart showing what percentage of the audience was still watching at each second of a video. Unlike average retention, which compresses everything into one number, the curve shows the exact location of the loss, and it is the only video metric that points at what to fix rather than merely reporting that something is wrong.
Read the entry
Views
Views are the number of times a piece of content was consumed, and since Instagram unified its metrics they apply to every format, not just video. A view includes repeat plays by the same person, which puts it closer to impressions and further from reach. It is now the headline number across most panels in the app, which made many people think reach and impressions had disappeared.
Read the entry
Hook rate
Hook rate is the percentage of people who got past the first seconds of a video instead of scrolling on. It is the metric that isolates hook performance, because it measures the one decision that happens before anything else in the content has a chance to matter. A video can have excellent content and a low hook rate, and in that case the problem is not the content.
Read the entry