Retention curve: how to read where people abandon your video

By Tiago Costa·Updated on August 5, 2026
Definition
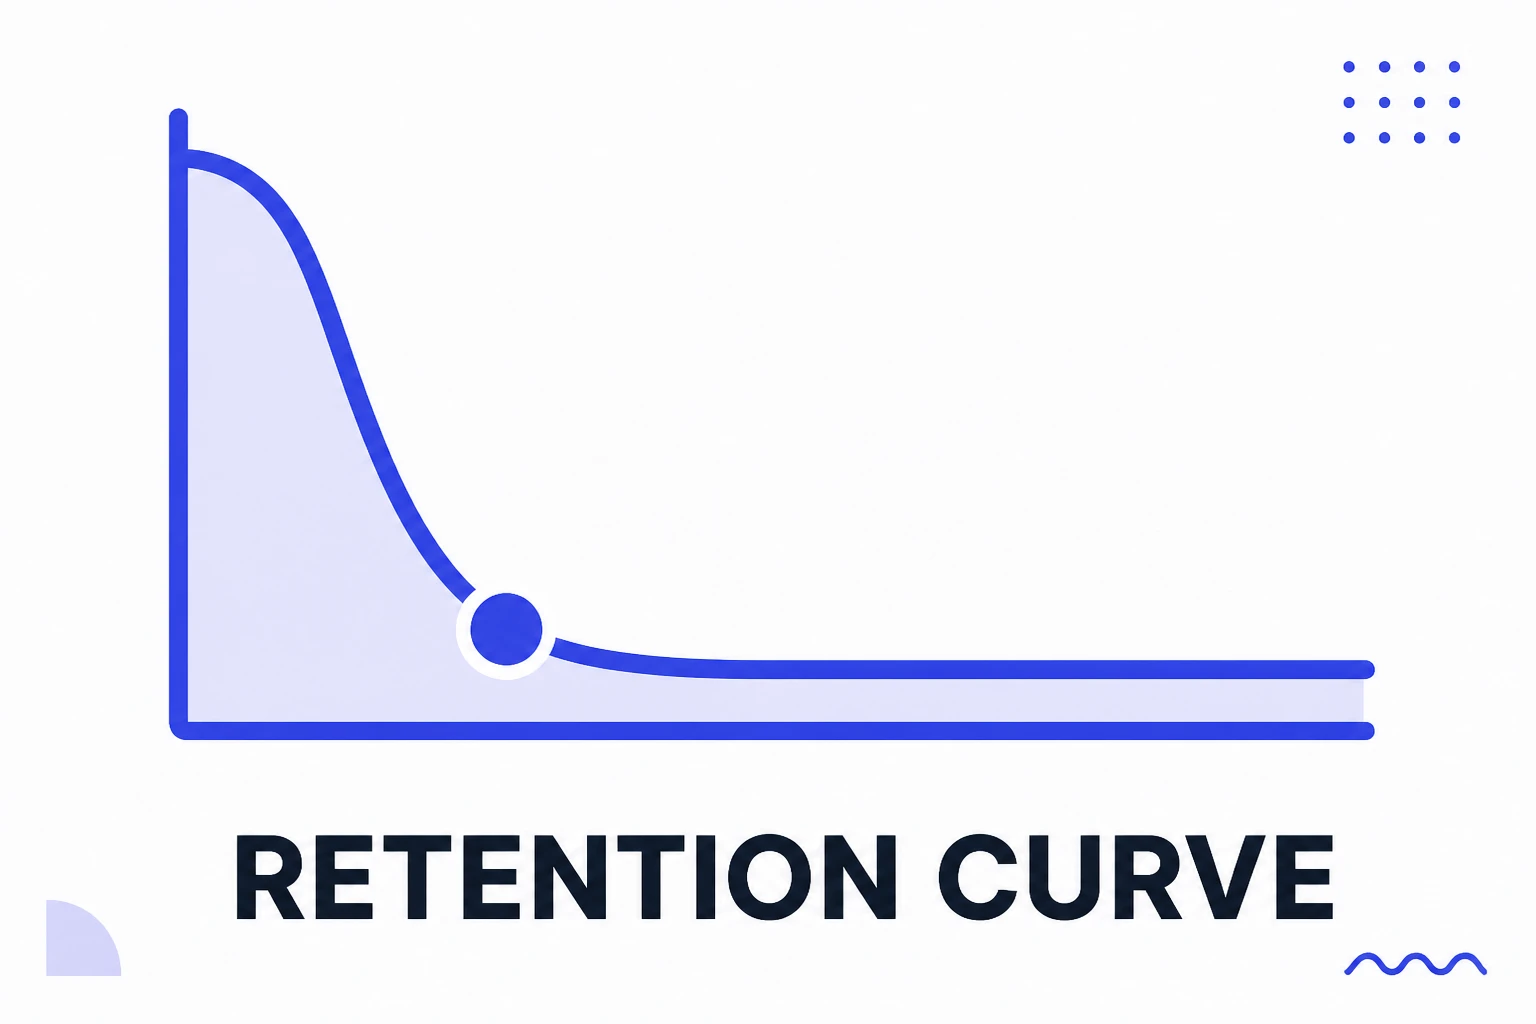
The retention curve shows what percentage of the audience was still watching at each second.
- It locates the loss, not just its size.
- An early drop is a hook problem.
- A middle drop is pacing or a promise not delivered.
- A rise at the end is replays, and it is a good sign.
How to read the curve
The horizontal axis is video time; the vertical is the percentage of people still watching. Every curve starts at 100% and falls, because nobody gains viewers midway, except through replays.
What matters is not the final height, which average retention already summarises. What matters is the shape: where it falls fast, where it goes flat, whether it has steps.
A drop always means something at that moment failed to justify continuing. Reading the curve is looking for those moments and watching the video at them.
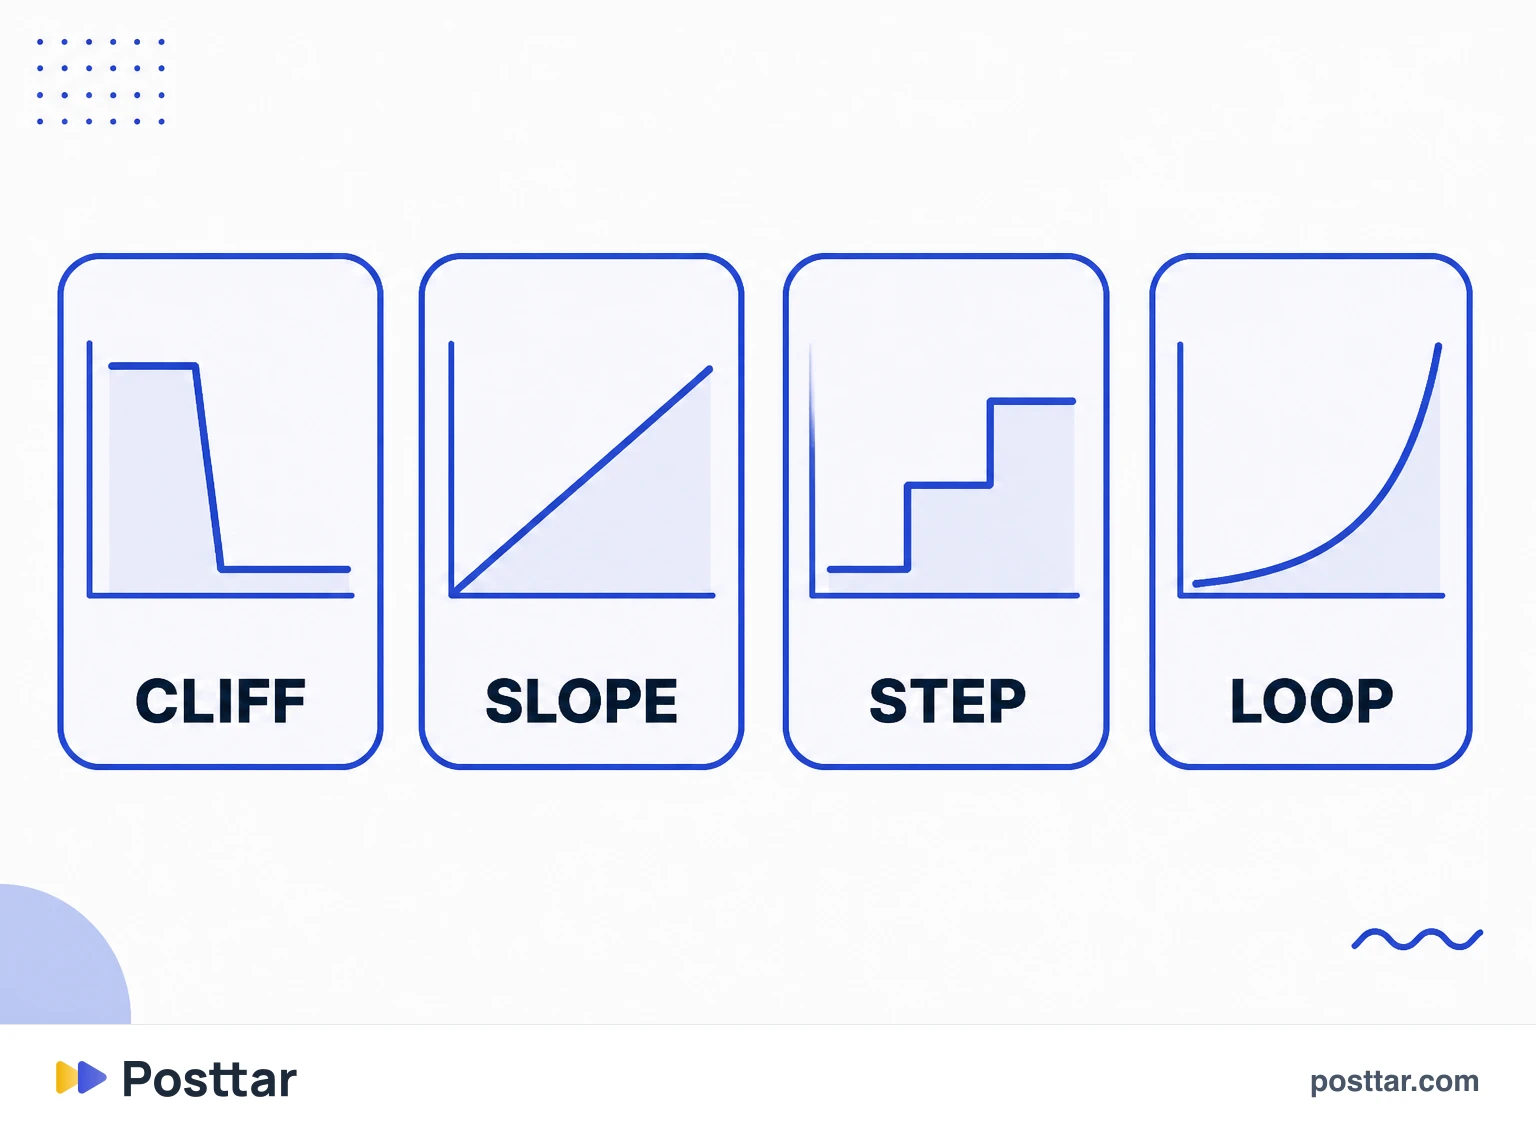
The four shapes that always appear
- Cliff in the first seconds. The curve collapses before second 3 and then goes flat. The hook failed: whoever stayed is interested, whoever left never learned what it was about.
- Steady slope. It falls evenly from start to finish. Usually slow pacing and no turning point, with no single point of blame.
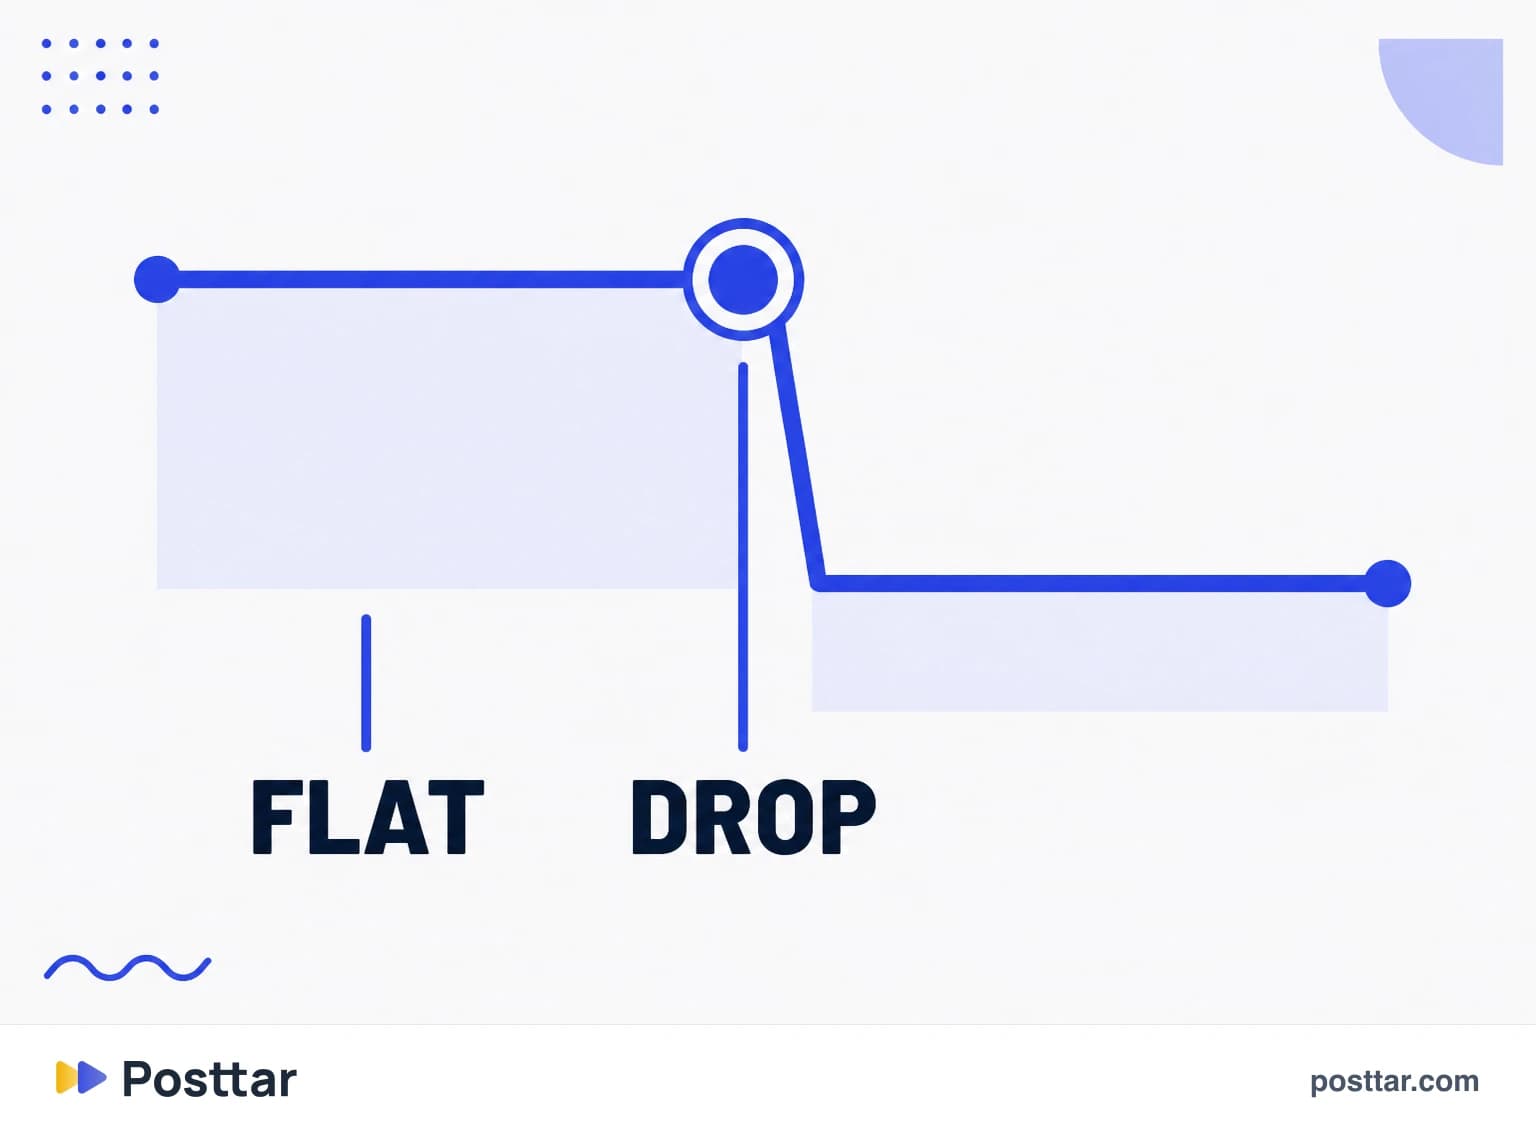
- Step in the middle. Flat, then a sharp drop, then flat again. Something specific sits there: a digression, a dragging stretch, or the promise delivered too early.
- Gain at the end. The curve rises in the last seconds. That is looping: people are rewatching, which adds watch time.
What to do with each diagnosis
| Curve shape | Likely cause | Fix |
|---|---|---|
| Early cliff | weak or generic hook | rewrite the first 3 seconds |
| Steady slope | slow pacing | cut pauses, speed up the edit |
| Middle step | digression or early payoff | cut the stretch, reorder |
| Gain at the end | the loop is working | strengthen the seam between end and start |
The golden rule of testing: fix one thing at a time. Changing hook and pacing in the same republish turns the experiment into an opinion.
Reading errors
- Reading a curve with few views. With a small sample the curve is noise. Wait for volume before concluding.
- Comparing curves of different lengths. A 10-second video and a 90-second one have naturally different shapes.
- Reading on publication day. The curve changes as distribution shifts audience.
- Blaming the content for a hook drop. If the loss happened at second 2, nobody ever saw the content.
Checklist
- I look at the shape of the curve, not just average retention.
- I wait for enough volume before interpreting.
- I watch the video at the exact point of the drop.
- I fix one variable at a time when republishing.
- I compare against curves from videos of similar length.
Frequently asked questions
What is a video retention curve?
It is the chart showing what percentage of the audience was still watching at each second. It starts at 100% and falls, and the shape of that fall indicates where the video lost people.
What does a drop in the first seconds mean?
It means the hook failed. People did not understand who the video was for, or saw no reason to continue. Whoever stayed past that drop tends to be qualified audience, and the fix is rewriting the opening, not the content.
Why does my curve rise at the end?
That is replays. On short videos the loop runs again for the same person, and it shows as a gain at the end of the curve. It is a good sign, because it adds watch time and indicates the piece holds attention.
Where do I find the retention curve on Instagram?
In the Reel insights on a professional account, alongside the other video metrics. It needs volume to mean anything: with few views the chart is noise.
What is the difference between the retention curve and average retention?
Average retention compresses everything into one number, and the curve shows how that number is distributed over time. Two videos can share the same average with completely different curves, and the fix each one needs is not the same.
Related concepts
Average retention
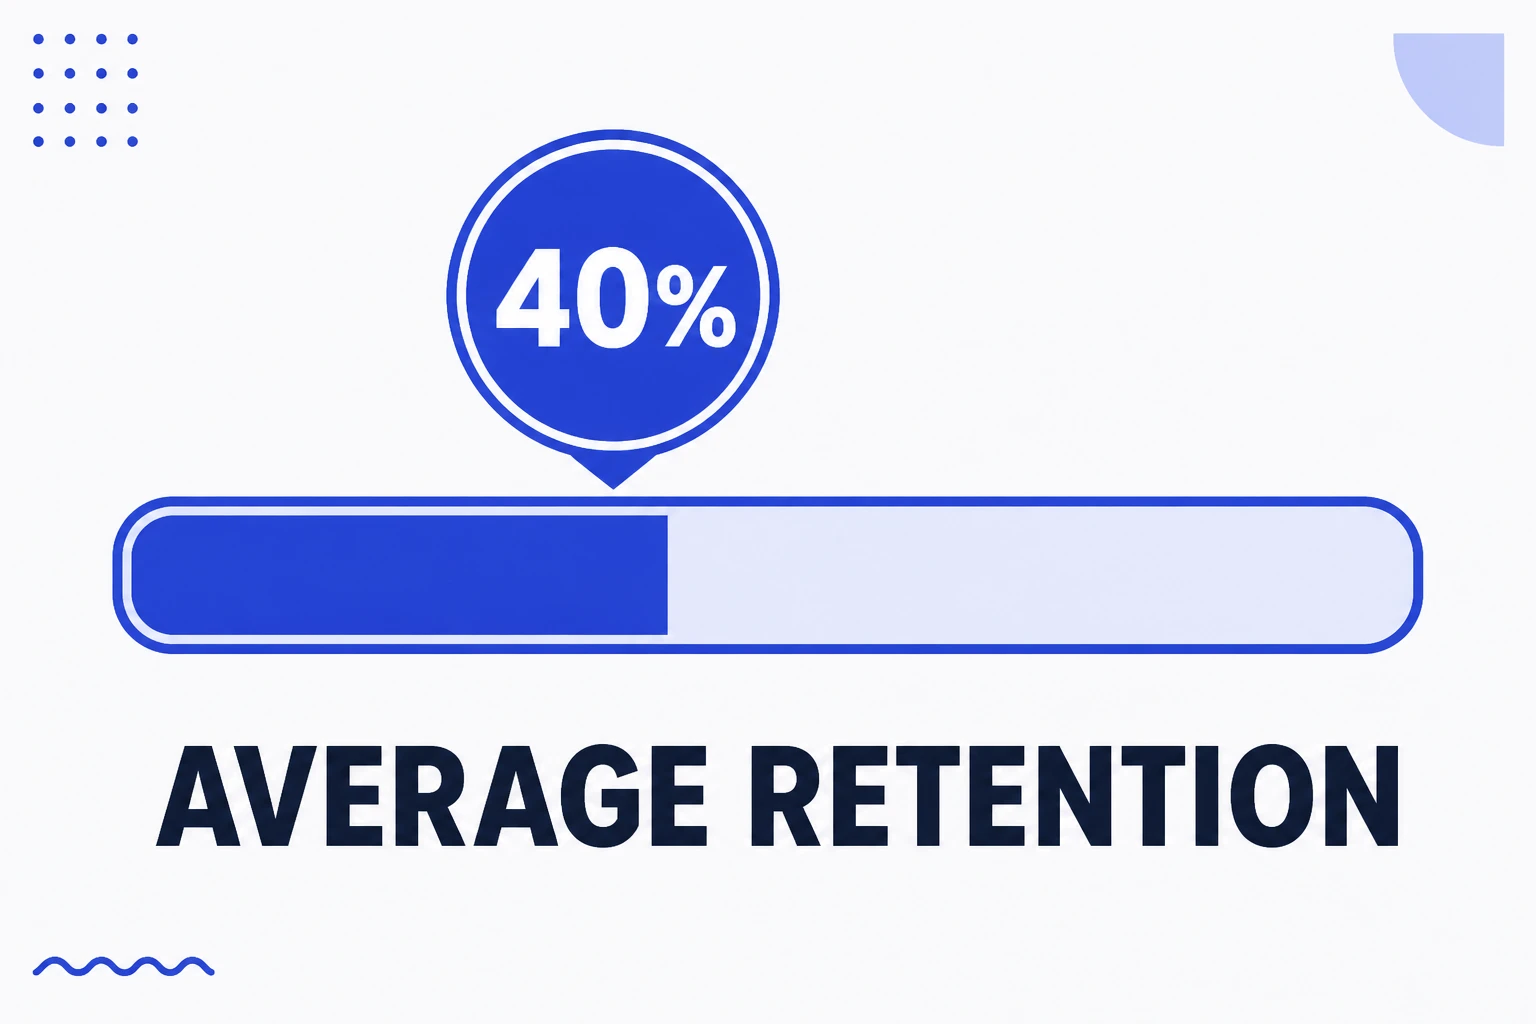
Average retention is the percentage of a video people watched, on average, before leaving. It is the percentage version of watch time, and it exists to make videos of different lengths comparable. It falls naturally as a video gets longer, which means comparing a ten-second Reel with a one-minute one using the same number is a misreading.
Read the entry
Hook rate
Hook rate is the percentage of people who got past the first seconds of a video instead of scrolling on. It is the metric that isolates hook performance, because it measures the one decision that happens before anything else in the content has a chance to matter. A video can have excellent content and a low hook rate, and in that case the problem is not the content.
Read the entry
Hold rate
Hold rate is the percentage of people who kept watching after getting past the first seconds, meaning how many of those the hook caught made it to the end. It is the natural pair of hook rate: while the hook measures whether the opening grabbed, the hold measures whether the content sustained. Separating the two is what tells you whether to rewrite the opening or re-edit the middle.
Read the entry
Hook
A hook is the opening of a piece of content, responsible for buying the first seconds of attention and making someone decide to keep going. In short video it occupies the first three seconds and is simultaneously verbal, visual and sonic; in a carousel it is the cover; in text it is the first line. A hook is not decoration: because the distribution system watches retention and dwell time, it determines whether the content ever gets delivered beyond the people who already follow you.
Read the entry