Metrics and analytics
Every number Instagram shows, what it actually measures, how to calculate what the platform does not hand over, and which indicators actually drive a decision.
30 terms

Reach
Reach is the number of unique accounts that saw a piece of content at least once. Unlike impressions, it does not count the same person twice, so it measures the size of the audience touched rather than the volume of exposure. On Instagram, reach is reported per post and per period, and it can be split between followers and non followers, which is the reading that shows whether a profile is discovering new people or simply circulating among those who already follow it.
Read the entry
Impressions
Impressions are the total number of times a piece of content was displayed, including repeat views by the same person. Unlike reach, which counts unique accounts, an impression counts the display: if someone sees the same carousel three times, that is one account of reach and three impressions. The ratio between the two is frequency, and it is what shows whether content is circulating inside the same bubble or finding new people.
Read the entry
Views
Views are the number of times a piece of content was consumed, and since Instagram unified its metrics they apply to every format, not just video. A view includes repeat plays by the same person, which puts it closer to impressions and further from reach. It is now the headline number across most panels in the app, which made many people think reach and impressions had disappeared.
Read the entry
Accounts reached
Accounts reached is the number of distinct accounts that saw any content from your profile in the selected period. It is the same idea as reach, applied to the whole profile instead of a single post: each person counts once, even if they saw ten posts, a Story and a Reel. That is why the number is never the sum of your posts' reach, and is always lower than it.
Read the entry
Frequency
Frequency is the average number of times each person reached saw the content, and it is calculated by dividing impressions by reach. It exists because reach alone does not say whether delivery was broad or repeated: a thousand impressions can be a thousand people seeing it once or a hundred people seeing it ten times. Do not confuse it with posting frequency, which is how often a profile publishes.
Read the entry
Reach rate
Reach rate is the percentage of your follower base that actually saw a piece of content, calculated by dividing reach by follower count. It exists because absolute reach is not comparable across accounts or across moments: a thousand accounts reached is excellent for a profile with two thousand followers and poor for one with two hundred thousand. It turns reach into an efficiency metric instead of a size metric.
Read the entry
Engagement
Engagement is the set of interactions people have with a piece of content: likes, comments, saves and shares, plus Story replies and mentions. It is an absolute count, not a percentage, which is why it only makes sense against a base, either reach or follower count. The four interactions are not equal: the ones that cost the viewer more effort are the ones that push distribution hardest.
Read the entry
Engagement rate
Engagement rate is the percentage of people who interacted with a piece of content relative to a comparison base. Two formulas are in common use: interactions divided by followers, which measures how the base responds, and interactions divided by reach, which measures the quality of delivery. They answer different questions and produce different numbers for the same post, so the thing that matters is stating which one you used before comparing anything.
Read the entry
Engagement rate by reach
Engagement rate by reach is the percentage of people who saw a piece of content and reacted to it, calculated by dividing total interactions by reach. Unlike the follower-based rate, it removes from the calculation everyone who never saw the post, which makes it the correct reading for judging content. In exchange, it can only be calculated by someone with access to insights, which makes it useless for comparing profiles from outside.
Read the entry
Likes
A like is the simplest interaction on Instagram: one tap that records approval, with no cost in time or exposure for the person doing it. Because it is cheap, it is the most abundant interaction and, at the same time, the weakest as a quality signal. It remains useful as a fast thermometer and as visible social proof, but judging content by likes alone means reading the metric that least separates a good post from a mediocre one.
Read the entry
Comments
A comment is the interaction where someone writes publicly under a post. It costs time and exposes the writer, which makes it a stronger signal than a like and one of the interactions that most sustain feed distribution. It is also the only one that creates conversation: every reply you write reopens the post for the person who commented and keeps the piece alive for longer.
Read the entry
Shares
A share is when someone sends your post to another person in Direct or reposts it to their own Stories. It is the most expensive interaction for the person acting, because it requires choosing a recipient and owning the recommendation, and that is why it pushes distribution outside your audience harder than anything else. No other interaction delivers content to a non follower through a human recommendation.
Read the entry
Saves
A save is when someone files your post away to return to it later. It is a private interaction: it does not appear on the post, nobody but the saver knows, and you only see the aggregate total in insights. Precisely because it has no social component, it is one of the most honest signals available, since people save for their own usefulness rather than to be seen saving.
Read the entry
Save rate
Save rate is the percentage of people who saw a piece of content and filed it away for later, calculated by dividing saves by reach. It isolates the usefulness dimension of engagement: while likes measure approval and comments measure willingness to talk, saves measure whether the piece was considered worth consulting again. It is the most direct metric for deciding which topic deserves to become a series.
Read the entry
Share rate
Share rate is the percentage of people who saw a piece of content and sent it to someone else, calculated by dividing shares by reach. Among all engagement metrics, it is the one that best anticipates growth, because every share carries the piece to an audience that is not yours, with a layer of human recommendation that no automatic delivery has.
Read the entry
Watch time
Watch time is the total amount of time people spent watching a video, summing every play. It is a volume metric, measured in minutes or hours, and it differs from retention, which is a percentage. The distinction matters because the two can move in opposite directions: a long video with low retention can accumulate more total time than a short one watched in full.
Read the entry
Average retention
Average retention is the percentage of a video people watched, on average, before leaving. It is the percentage version of watch time, and it exists to make videos of different lengths comparable. It falls naturally as a video gets longer, which means comparing a ten-second Reel with a one-minute one using the same number is a misreading.
Read the entry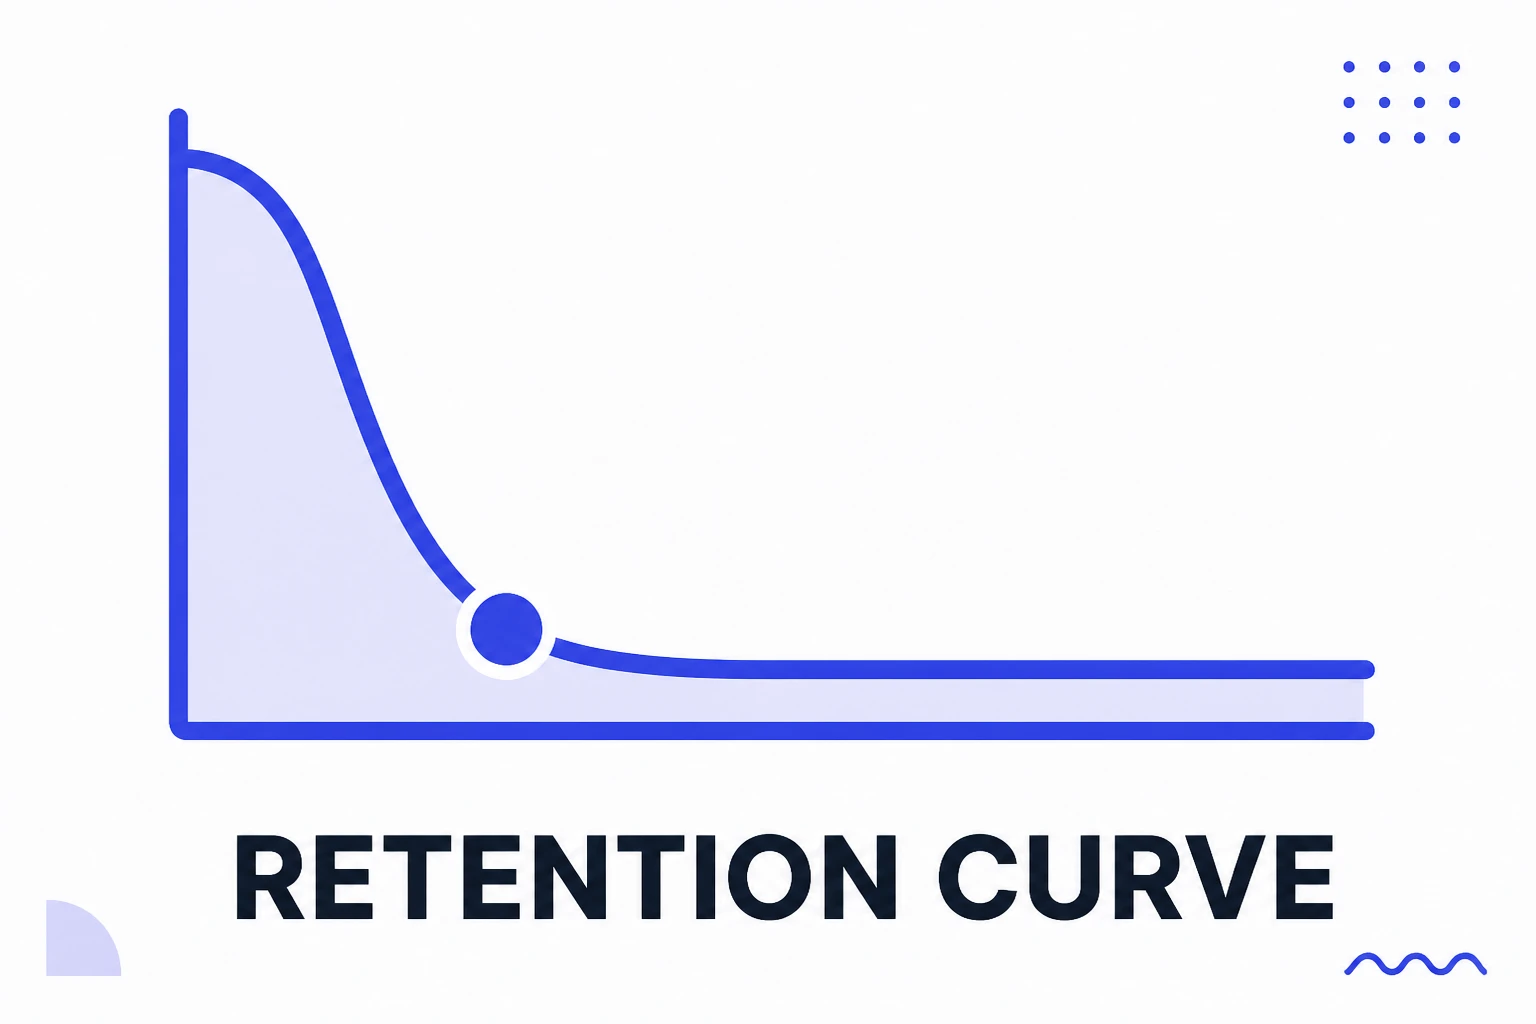
Retention curve
The retention curve is the chart showing what percentage of the audience was still watching at each second of a video. Unlike average retention, which compresses everything into one number, the curve shows the exact location of the loss, and it is the only video metric that points at what to fix rather than merely reporting that something is wrong.
Read the entry
Hook rate
Hook rate is the percentage of people who got past the first seconds of a video instead of scrolling on. It is the metric that isolates hook performance, because it measures the one decision that happens before anything else in the content has a chance to matter. A video can have excellent content and a low hook rate, and in that case the problem is not the content.
Read the entry
Hold rate
Hold rate is the percentage of people who kept watching after getting past the first seconds, meaning how many of those the hook caught made it to the end. It is the natural pair of hook rate: while the hook measures whether the opening grabbed, the hold measures whether the content sustained. Separating the two is what tells you whether to rewrite the opening or re-edit the middle.
Read the entry
Followers
Followers are the accounts subscribed to a profile. For years the number was treated as a synonym for reach, but with delivery now depending on recommendation rather than only on who you follow, the base became something more modest and more important at once: it does not guarantee anyone sees the content, and it remains the only audience you can reach without depending entirely on the algorithm.
Read the entry
Growth rate
Growth rate is the net follower gain over a period divided by the base at the start of that period. It measures pace rather than size, which makes it the correct way to track an account over time and to compare profiles of different sizes. Net gain means new followers minus people who unfollowed, and ignoring that subtraction is the most common reading error.
Read the entry
Unfollow
An unfollow is when someone stops following a profile. Instagram reports how many followers were lost in each period, but never who they were, and it notifies neither side. As a metric, losses only make sense read alongside gains: two months with the same number of new followers can produce opposite results depending on how many left in the same window.
Read the entry
Audience demographics
Audience demographics are the aggregate characteristics of the people following a profile: age band, gender, city, country and peak activity hours. Instagram provides them only to professional accounts and only above a minimum follower count, always aggregated and never individual. The most useful reading is not the snapshot of your base, it is the difference between who follows you and who you are reaching.
Read the entry
Fake followers
Fake followers are accounts that follow a profile with no real person behind them, or with a person who never had any interest in the subject: automated profiles, bulk-bought accounts and giveaway followers unrelated to the topic. The damage is not cosmetic. They enter every denominator, drag your rates down, teach the recommendation system the wrong audience, and are visible to any brand evaluating a profile before signing a sponsorship.
Read the entry
Profile visits
Profile visits is the number of times your profile page was opened during a period. It is the closest thing to an intent metric Instagram provides organically: nobody opens a profile by accident, and whoever does is deciding whether to follow, buy or click the link. The panel shows only the total, never who visited, and there is no legitimate way to find that out.
Read the entry
Link clicks
Link clicks is the number of taps on the clickable links of a profile and Stories: the bio link, action buttons and the link sticker. It is the metric that closes the funnel inside Instagram, because it marks the moment someone leaves the app. The insights number almost never matches your website analytics, and the reasons for that are well known and do not indicate an error.
Read the entry
CTR
CTR stands for click-through rate: the percentage of times a clickable element was tapped relative to how many times it was displayed. It is a measure of call efficiency, not of product quality, and what counts as a good number varies so much across contexts that comparing CTR between channels is almost always a reading error.
Read the entry
Instagram Insights
Instagram Insights is the native metrics panel for professional accounts. It gathers reach, views, interactions, audience data and profile activity, at no cost, inside the app itself. Two limitations define how to work with it: the data window is short, so history erases itself, and nothing there identifies people, which settles upfront every question about who saw or who visited.
Read the entry
Meta Business Suite
Meta Business Suite is Meta's free hub that brings publishing, messages and metrics for Instagram and Facebook into one place, accessible via browser and its own app. It handles three things the Instagram app handles poorly: scheduling ahead, answering messages from both channels in one inbox, and reviewing metrics on a large screen over longer periods. What it does not handle is anything that depends on a feature exclusive to the app.
Read the entry